Asset Managers
Asset Managers
Today, asset managers, whether traditional long-only or alternative asset managers, face numerous data-related challenges and ever increasing reporting requirements from internal constituents such as the investment team, middle and back office as well as external constituents such as the regulators and investors.
Fundamentally, most asset managers suffer from inadequate infrastructure, a lack of proper processes, piecemeal software systems and over reliance on manual and spreadsheet-driven reporting.
Typically, we have found asset managers struggle with the many of the following challenges listed below.

Typical Asset Manager’s Challenges
Aggregating Investment Data: scattered in numerous places (e.g., fund admin, accounting system, custody bank, spreadsheets, etc.,)
Lack of Robust Analytics: for meaningful performance attribution and risk management metrics, etc.,
Manual Reporting Process: reliant on spreadsheets for reporting
Institutional Quality: meeting investors’ demands for institutional-quality reporting and transparency
Regulatory and ESG Reporting: performing numerous and complex regulatory and ESG reporting requirements
Actionable Reporting: for sound investment and risk management and monitoring

Complete Solution
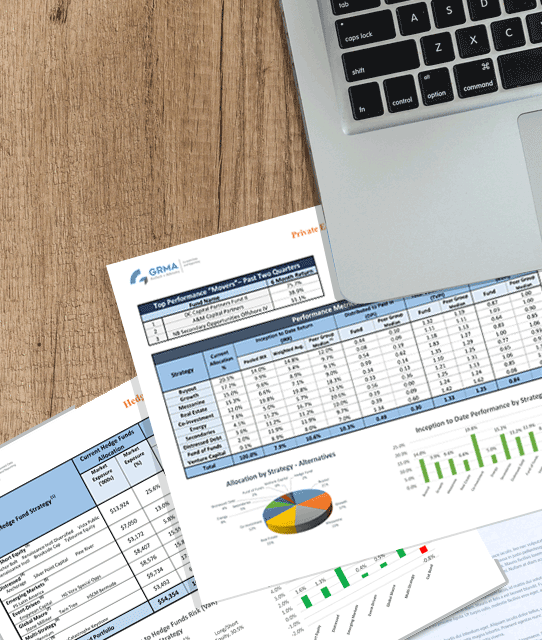
We provide asset managers and asset owners with better portfolio insight and streamlined workflows for: data management, reporting and portfolio monitoring. Our solution comprehensively covers all public and private investments and can handle all types of internal and external reporting.
In order to address the scattered data challenges that most asset managers face, we have developed unique technology including artificial intelligence and machine learning to efficiently scrape, extract, aggregate, and curate all investment-related data.
Our outsourced reporting solution encompasses: investment holdings exposure, performance attribution and benchmarking, compliance with investment policy limits, risk management and ESG metrics. Solution options for clients include: custom reports, dynamic dashboards and cloud data storage. In addition, with our extensive practitioner and industry experience, we can provide value-added advisory services to our clients.
Types of Reporting and Advisory Services
Regulatory Reporting Examples
• Form SHO
• Form PF, CPO-PQR
• AIFMD/Annex IV
• UCITS
• N-PORT
• FATCA
• MiFID II
• Form 13F, 13D, 13G
• SFDR
Investor Reporting Examples
• Transparency Reporting (e.g. Open Protocol, Hedge Platform, ILPA Reporting)
• Ad-hoc Data or Analysis Requests from Investors
• ESG Data and Reporting
ESG Reporting Examples
Best Coverage and Most Comprehensive ESG Solution
- Global Data Coverage for Publics:
• Over 330,000 funds
• 9,000 listed companies
• 80%+ of global market cap
- Comprehensive Indicators & Metrics:
• 70+ key ESG indicators
• 400+ ESG metrics
- Private Funds, Portfolio Companies and Corporates
• ESG Data & Metrics
• ESG Reporting and Monitoring
- ESG Advisory
• ESG Disclosures
• ESG Policy and Procedures
• ESG Compliance Limits
• Meet Best Practice Standards and Regulatory Requirements for ESG
Portfolio & Risk Management and Monitoring Examples
• Exposure Analysis
• Risk Limits Compliance Reports
• Performance Attribution and Benchmarking
• Risk Management Metrics and Analysis
• Factor Analysis
• Hedging Analysis
Expert Advisory Services Examples
• Investment and risk management governance and process and controls
• Investment risk management policies and procedures
• Risk management limits and policy guidelines
• Marketing decks, PPMs, DDQs and other disclosure documents
• Hedging and risk mitigation advisory
Curated Data and Metrics
Holdings and Portfolio Exposure
Exposure Break-Down Examples:
• Long/Short, Gross/Net
• Delta/Beta Adjusted
• Industry Sector
• Geography
• PM/Trader
• Portfolio Factors
Risk Management
- Value-at-Risk (VaR)
- “Greeks” (e.g. Delta, Vega)
- Liquidity Risk Profile
- Stress Testing/Scenario Analysis
- Credit and Counterparty Risk
Performance Attribution/Benchmarking
- Performance Attribution Examples:
– PM/Analyst
– Strategy
– Asset class
– Position
– Top “Winners/Losers”
- Performance vs. Benchmarks
- Correlation Analysis
- Public Market Equivalents (PME)
- Risk-Adjusted Metrics (e.g. Sharpe ratio, Sortino ratio)
GRMA’s Unique SaaS Solution Features:
No need for software and technology build or buy
No lengthy or client-side implementation
Significant time and cost savings for all internal and external reporting
Meets all needs for regulatory reporting requirements
Satisfies all needs for investor and transparency reporting
Superior and less costly to in-house build or all other “buy” options
Flexible Delivery: curated data file; customized reports; dashboard; regulatory upload file
Our fees are a fund expense for many asset managers
Find out what our solutions can do for your institution or company.
SITEMAP
CONTACT
MAIN OFFICE: 212-230-1099
GENERAL: INFO@GRMAINC.COM
HIRING: HIRING@GRMAINC.COM
ADDRESS: 757 THIRD AVENUE, 20th FLOOR NEW YORK, NEW YORK 10017
